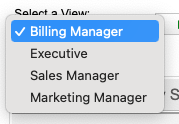
You can view dashboard reports of real-time data from your Aria instance organized within four persona-based views.
View Data in the Analytics Dashboard
Overview
Viewing Data in the Analytics Dashboard
Getting Here: Click Analytics and Reporting > Analytic Dashboard
The default view, which you can specify, displays. Here is the Billing Manager view:

Setting Your Default View
You can set the default view of the Analytics Dashboard to one of the four available views. Set the current view to the default by clicking the Set As Default next to the name of the view.

Analytics Dashboard Views
Each view available in the drop-down menu at the top of the Analytics Dashboard screen represents a persona. Selecting a different view allows you to view a different set of reports of interest to that persona.

Live data from your Aria instance populates each report panel and may some time to load onscreen. If no data matches the criteria of the query that defines a given report, the panel remains blank.
Billing Manager View
The Billing Manager view includes:
- Account Balance by Status. Displays a table of the top 10 account balances by account status and currency.
- Revenue Over Time. Displays total revenue per month over a specified time period. You can filter the results by currency and the number of months back:

- Collections Over Time. Displays collections by month and transaction type over the specified time period. You can filter the results by currency and the number of months back:

- MTD Totals by Transaction Type. Displays month-to-date totals by transaction type. You can filter the results by currency:

Executive View
The Executive view includes:
- YTD Totals by Transaction Type. Displays year-to-date totals by transaction type. You can filter the results by currency:

- Revenue Performance. Displays current revenue for today as compared to the average daily revenue for the past month or specified period. You can filter the results by currency, and by the number of days back:

- New Accounts. Displays current new accounts volume for today as compared to the average daily account volume for the past month or your specified time period. You can filter results by number of days back:

- Account Holder Churn. Displays accounts in churn (i.e. accounts that have been suspended, cancelled, or terminated) for the period specified. You can filter the results by number of months back, from one to 12 months:

Sales Manager View
The Sales Manager view includes:
- Revenue Over Time. Displays total revenue by month over the selected time period. You can filter the results by currency, and specify a date range going back one to 12 months:

- Monthly Revenue by Service Type. Displays revenue by type of service purchased. You can filter the results by currency, and specify a date range going back one to 12 months:

- Account Holder Churn. Displays accounts in churn (i.e. accounts that have been suspended, cancelled, or terminated) for the period specified. You can filter the results by number of months back, from one to 12 months.

Marketing Manager
The Marketing Manager view includes:
- Current Accounts by Promo Code. Displays promo codes with the most active accounts.
- Recent Coupon Redemption. Displays recent coupon redemptions organized by coupon code. You can specify the number of days in the past for which you want to view this data:

- Current Accounts by Master Plan. Displays all current accounts organized by the Master Plans they subscribe to.
